Canada Housing Market June 2026: Prices, Sales and Inventory
June 15, 2026
Canada housing market update for June 2026, using the latest April 2026 CREA/WOWA data on prices, sales, inventory, benchmark prices, and provincial trends.

Housing snapshot
Quick read
April 2026 data showed prices stabilizing nationally, modest sales improvement from March, and enough inventory to keep the market broadly balanced.
What's on this page
Canada's April 2026 housing data showed higher average prices, a slightly higher benchmark price, modest month-over-month sales improvement, and balanced national inventory conditions.
Canada housing market snapshot for June 2026
The latest WOWA housing-market report, published May 25, 2026, uses April 2026 CREA data. The headline is simple: prices improved from March, sales ticked up month over month, and inventory gave buyers more choice than last year. That is not the same as a runaway seller's market. National conditions still looked broadly balanced.
This snapshot means the national market had stabilized, but it had not become hot across the board. The average sold price rose 3.3% from March 2026 and 2.2% from April 2025. The benchmark price rose only 0.3% from March and stayed 4.1% below April 2025. That gap matters. The average can move when the mix of homes sold changes. The benchmark tries to track a typical home, so it can give you a cleaner read on the market underneath the monthly noise.
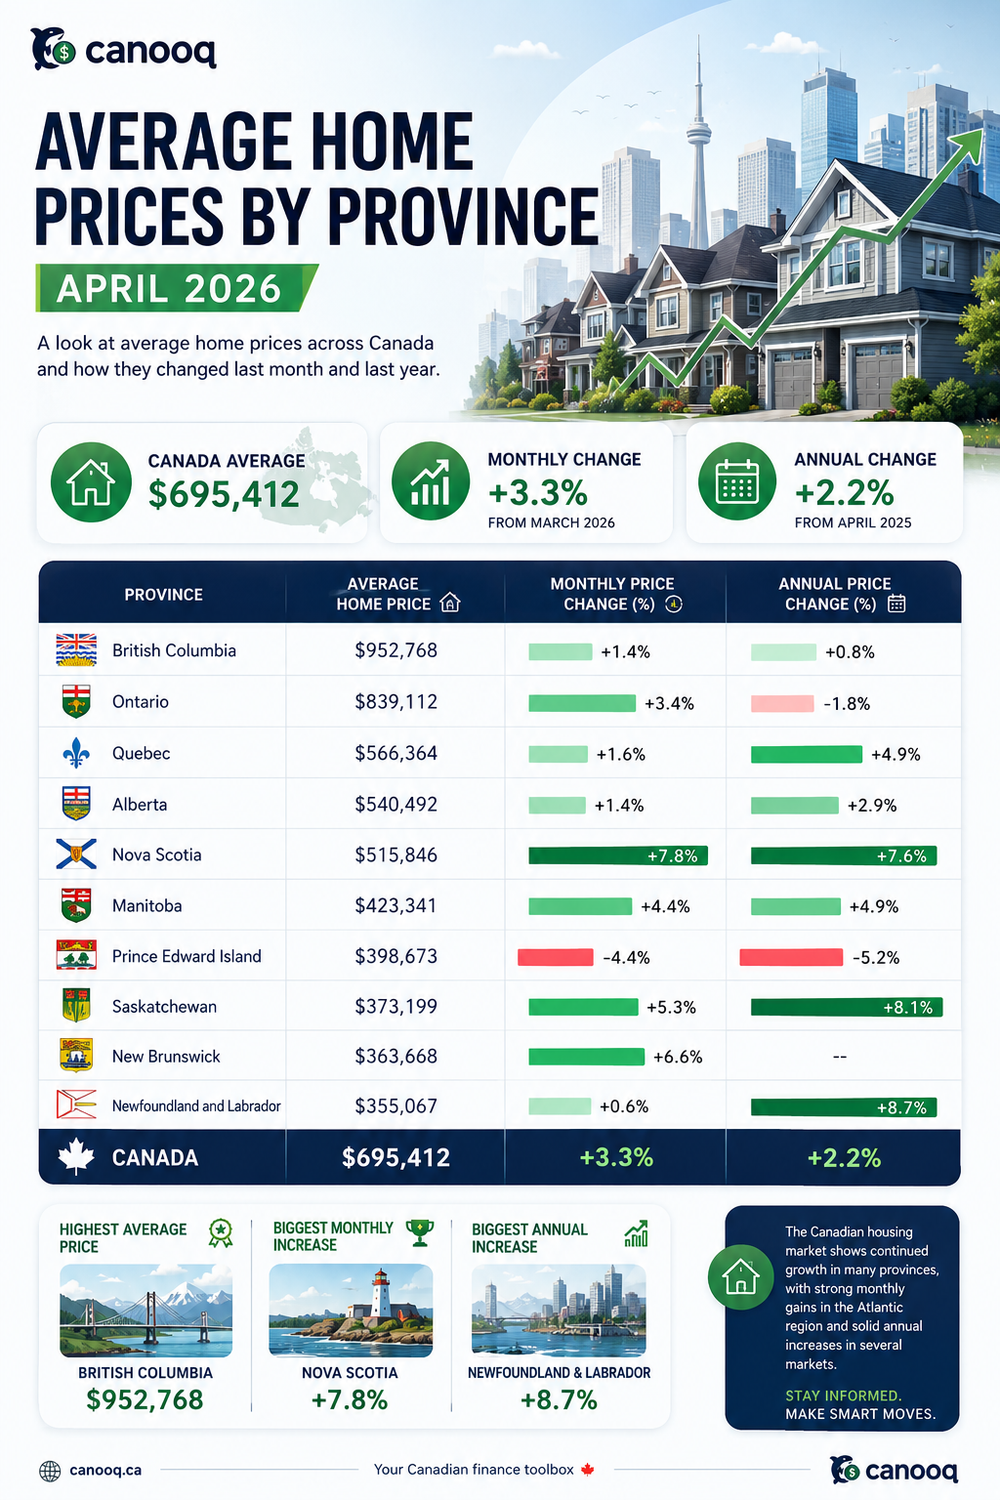
The national average price rose above last year
Canada's average home price reached $695,412 in April 2026, up from $673,084 in March 2026 and $680,336 in April 2025. That tells you buyers were paying more on average than one month earlier and one year earlier.
The benchmark price told a cooler story. It reached $666,400 in April 2026, up slightly from $664,400 in March, but still down 4.1% from April 2025. If you are shopping, that is the number to watch beside local inventory and mortgage rates. The average price can jump because more expensive homes sold. The benchmark asks a different question: what is happening to a typical home?
Sales improved from March, but stayed below last year
National sales reached 35,578 on a seasonally adjusted basis. That was up 0.7% from March 2026, when sales were 35,321, but down 4.2% from April 2025, when sales were 37,136.
That mix points to a market waking up for spring without fully breaking out. More buyers came back compared with March, but activity still lagged last year. For a buyer, that can mean more time to compare homes. For a seller, it means pricing still has to make sense.
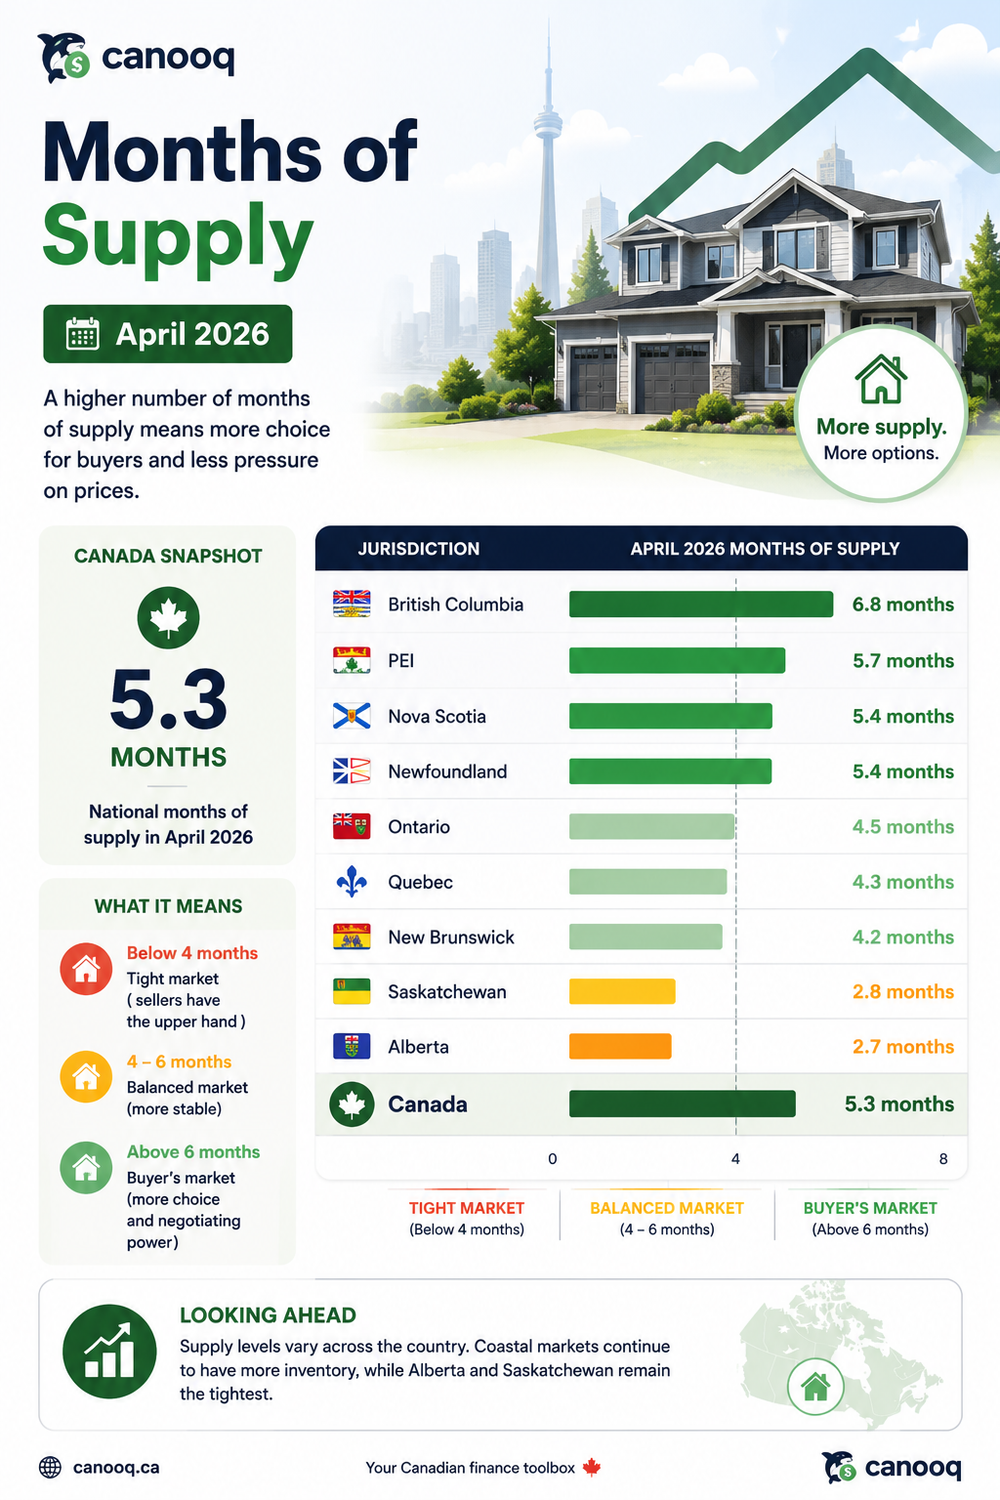
Inventory moved toward buyers
Months of supply increased to 5.3 months, and the sales-to-new-listings ratio eased to 45.6% from 47.8% in March 2026. Active listings were 2.2% above April 2025.
A higher months-of-supply number means buyers have more homes to choose from. A lower sales-to-new-listings ratio means fewer new listings are being absorbed right away. Put together, April looked balanced nationally, with more breathing room than a tight seller's market.
Province benchmark prices were split
The national number hides two different markets. British Columbia and Ontario still had benchmark prices down 5.7% year over year. Quebec, Newfoundland, Saskatchewan, PEI, Nova Scotia, and New Brunswick posted positive annual benchmark changes.
Benchmark home prices by province
WOWA/CREA benchmark prices for April 2026. Monthly and annual changes are percentage changes reported in the WOWA market report.
| Province | Benchmark price | Monthly change | Annual change |
|---|---|---|---|
| British Columbia | $889,800 | +0.1% | -5.7% |
| Ontario | $752,400 | +0.4% | -5.7% |
| Quebec | $550,800 | +0.3% | +5.0% |
| Alberta | $514,000 | +0.9% | -2.4% |
| Nova Scotia | $440,800 | +0.8% | +2.4% |
| PEI | $378,900 | +0.5% | +4.0% |
| Saskatchewan | $374,300 | +0.1% | +4.5% |
| Newfoundland | $339,400 | +1.6% | +9.8% |
| New Brunswick | $324,400 | -1.5% | +1.3% |
| Canada | $666,400 | +0.3% | -4.1% |
Quebec, Nova Scotia, Saskatchewan, and Newfoundland set benchmark price records in April 2026. Quebec's benchmark reached $550,800 and marked its fourth consecutive monthly record. Quebec, Nova Scotia, Saskatchewan, Manitoba, and New Brunswick also set records for average sold prices.
What this means if you are buying
- Do not use the national average price as your budget. Your city, neighbourhood, property type, condo fees, taxes, insurance, and mortgage rate matter more.
- Treat the balanced national market as a signal to compare carefully. You may have more choice than last year, but good listings can still move quickly in tight local markets.
- Stress-test your budget with today's mortgage rates, then repeat the math with a higher rate before you make an offer.
Start with the mortgage affordability calculator and the rent vs buy calculator. If you are early in the process, read Should You Buy a Home in Canada? before you fall in love with a listing.
What this means if you are selling
A balanced market does not mean sellers have no leverage. It means pricing has to respect the competition. If active listings are higher and buyers have more choice, a stale listing can become expensive: more price cuts, longer carrying costs, and weaker negotiation energy.
Look at recent comparable sales, not asking prices. If your province or city is setting records, your local segment may still be strong. If you are in a market where benchmark prices are down year over year, assume buyers will compare hard.
How to read this monthly update
Each month, use the same order: price, sales, inventory, then local market. Price tells you where the market moved. Sales tell you whether buyers are active. Inventory tells you who has negotiating room. Local data tells you whether the national story applies to your actual decision.
Mortgage rates also matter. A small change in rate can move affordability more than a small change in price. Pair this market update with Mortgage Rates in Canada in June 2026 and the step-by-step home buying guide.
Related articles:
Page details
Author: Canooq Editorial
Updated: June 15, 2026
Cite this page: Canooq.ca, Canada Housing Market June 2026: Prices, Sales and Inventory, https://www.canooq.ca/blog/canada-housing-market-june-2026
Canooq content is educational and may include affiliate or referral links. It is not financial, tax, legal, immigration, employment, mortgage, real estate, or healthcare advice. Verify official sources and provider terms before acting.